This is one case where it’s not too rude to ask how much someone’s making – because that information is public.
The Squamish-Lillooet Regional District has published its 2016 statement of financial information, revealing how much its directors make, as well as the earnings for employees paid more than $75,000 per year.

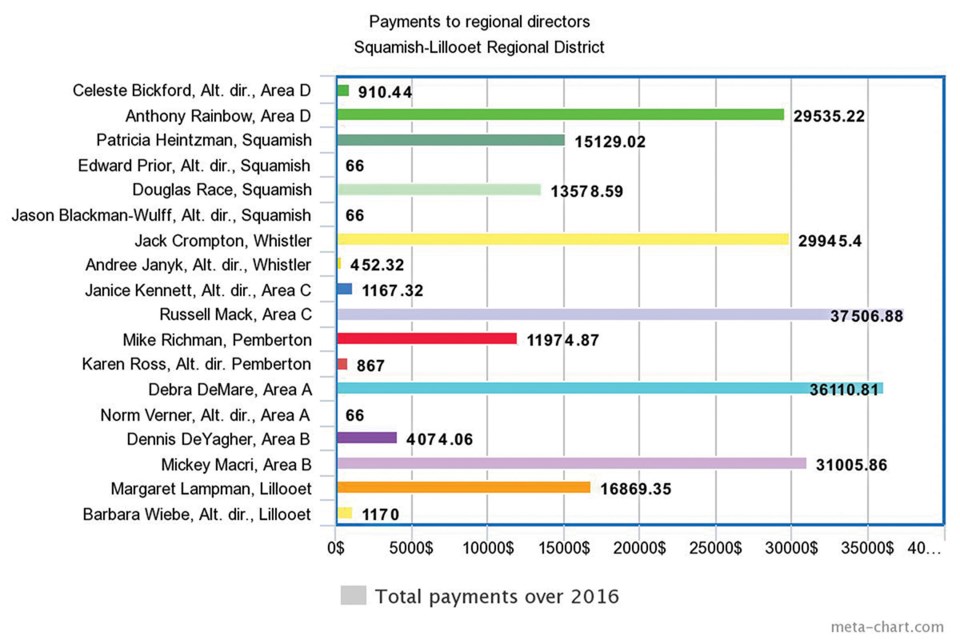
CORRECTION: The graph left out Dennis DeYagher's proper job title. For the record, this person is an alternate director, NOT a regularly serving regional director. - Graphic by Steven Chua
In Figure 1, the amount each director makes is displayed. Squamish residents will also want to pay attention to the directors representing Area D, as that refers to the broad region which also includes the municipality and its neighbouring areas such as Britannia Beach.
Another thing to note is that alternate directors – indicated on the chart with the abbreviation “Alt.” – are also displayed.
They make less because they serve only when a director is unable to attend.
The amount of money paid out to each director also includes expenses, which can run in the tens of thousands, and life insurance which is a $66 payment. Finally, fees are also included in that total amount. Directors are paid $156 for each board meeting, committee of the whole and electoral area director meeting. This also applies to any other approved meetings greater than three hours in length. A $90-dollar fee is paid for other approved meetings less than three hours.
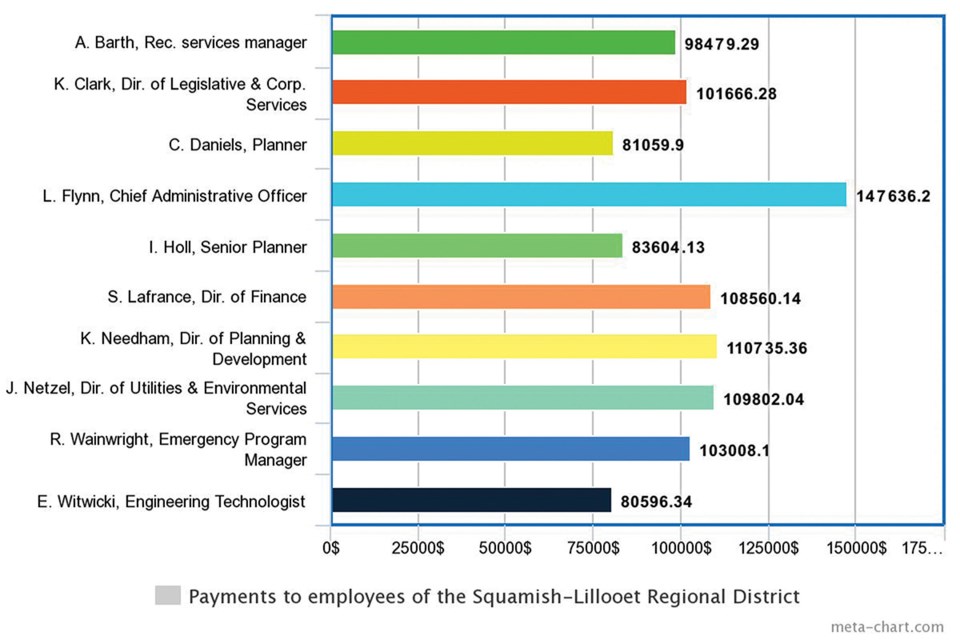
Also available for perusal are the total amount of payments – including expenses – made to the regional district’s top employees, which can be viewed in Figure 2. This information is available for all employees who make more than $75,000.
Benchmarking the SLRD against other regional districts gives perspective
Many taxpayers will be wondering if they’re getting the best bang for their buck, now that the Squamish-Lillooet Regional District has revealed its financial information for 2016.
One question that will no doubt arise is whether public servants are getting paid too much or too little.
It’s a tricky question that comes with few concrete answers – but a Simon Fraser University professor says one thing that can help is a term known as benchmarking. It is, in other words, the data-driven equivalent of peering over the white picket fence to see how you’re keeping up with the Joneses.
“Take a very hard look at other areas,” said SFU professor Lindsay Meredith.
But it can often be a more tricky affair than simply picking a neighbouring regional district and making the comparison.
The danger of, say, comparing the SLRD to a close neighbour like Metro Vancouver, is that it can often be like comparing apples and oranges.
“This is like the captain of a tugboat saying, ‘Hey I’m a captain, therefore, I need a captain’s salary, and what do we benchmark it off... an aircraft carrier,” said Meredith.
It’s a valid concern – directors and employees of the SLRD oversee capital assets worth about $35.4 million, which is dwarfed when compared with Metro Vancouver, which has $4.54 billion in capital.
In order to make an effective comparison, it would be prudent to pick other regional districts that have similar characteristics.
Meredith said it’d be best to look for regional districts with similar population sizes, numbers of employees, and similar financial and capital situations, among other things. And while these comparisons are an imperfect tool – no two communities are ever exactly the same – it can help residents decide for themselves if there are any irregularities.
To this end, The Chief compiled the average earnings of regional directors and top employees of the Squamish-Lillooet Regional District and compared them with three other regional districts.
The regional districts of Bulkley-Nechako, Kitimat-Stikine and Strathcona were all selected because they, along with the SLRD, share several common traits.They serve populations ranging from about 36,000 to 46,000. These communities also have capital assets valued in the lower tens of millions – between $14 million and $36 million.
They have similar amounts of employees making over $75,000 – between seven to 11.
They have similar numbers of directors, ranging from 18 on the low end to 25 at the most.
Finally, they also all have accumulated surpluses in the lower tens of millions, ranging from $15 million to $38 million.
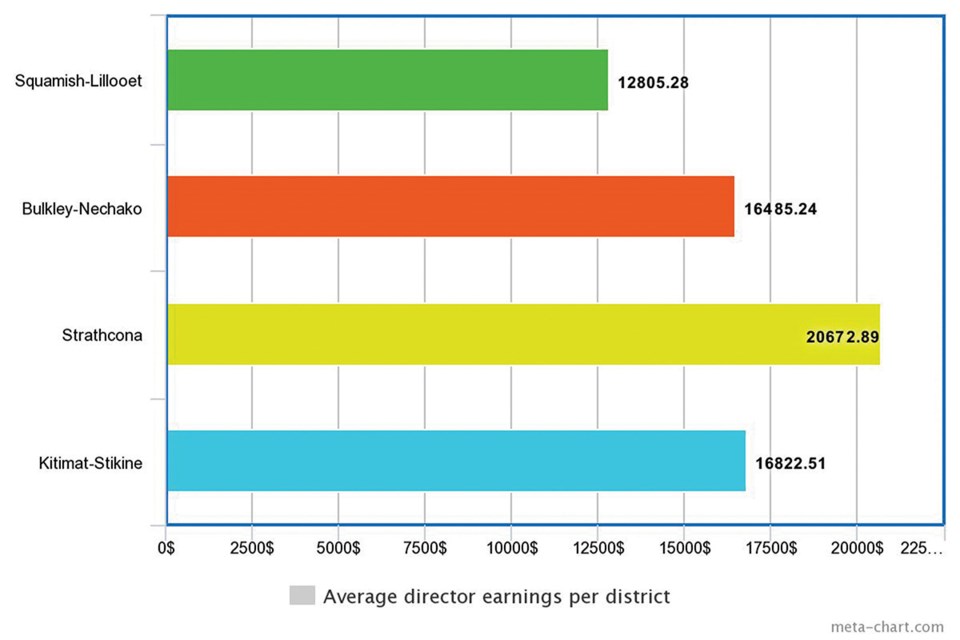
Figure 3 shows the average earnings per regional director for each regional district, expenses included.
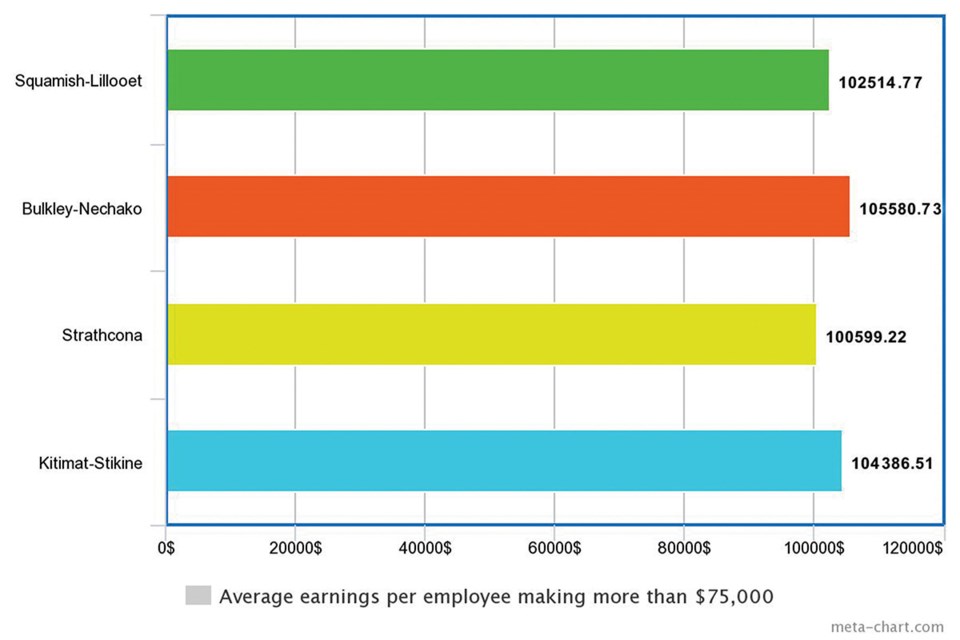
Figure 4 shows the average earnings per employee making more than $75,000 a year for each regional district. Expenses are also included in this income.
So have a peek over the picket fence and see if you think the SLRD is keeping up with the Joneses.


