Squamish’s Top 10 most paid employees in 2018 had pay increases ranging from less than one per cent all the way up to almost 16 per cent, compared with their salaries in 2017.
At the same time, elected officials didn’t see much of a pay increase — but that can be attributed to the 2018 election, which put a premature end to the salaries of outgoing politicians.
These were some of the findings in the District’s 2018 statement of financial information, which lists compensation and other spending from the municipality. It was released this summer.
Pay for many non-elected municipal staff is determined through bargaining with their union, CUPE 2269. Their collective agreement stipulates annual increases from 2016 to 2019, ranging between 1.5-to-2 per cent.
Firefighters are unionized, but are covered by the International Association of Fire Fighters.
However, upper management — which is heavily represented in the top earners — is not unionized. In addition, engineers, planners, human resources employees, financial analysts, and other positions, such as the legislative and executive assistants are not unionized, either.
SFU’s Andy Yan, the director of the university’s city program, said municipalities need to be competitive when attracting and retaining good staff.
“You want to compensate them because you want to both attract and retain talent,” Yan continued.
“The other side of it is that you only have a certain pool to draw on for municipal management, and so you want something that is within a certain range. Because, otherwise, you won’t be able to draw upon that talent pool. Or, more importantly, perhaps, keep the talent.”
He also noted that Squamish’s rapid pace of development and population growth may have made municipal staffers’ jobs tougher. There could have also been adjustments for inflation, Yan added.
There were 60 people — up from 56 in 2017 — who exceeded the $75,000 threshold. Financial disclosure rules stipulated that employees who meet this mark must have their income publicly reported.
The Chief has compiled some of the results into several graphs below.
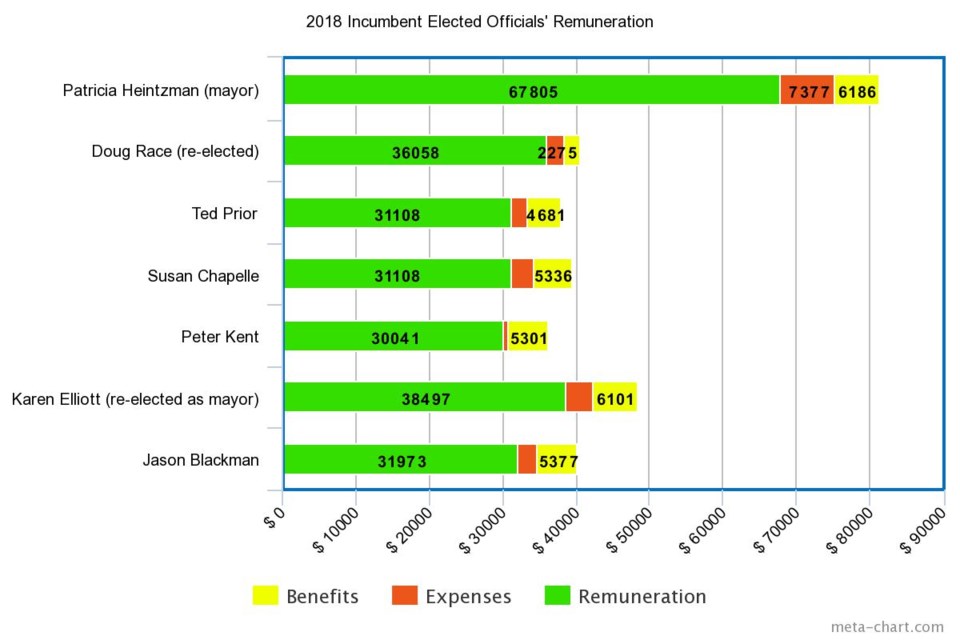
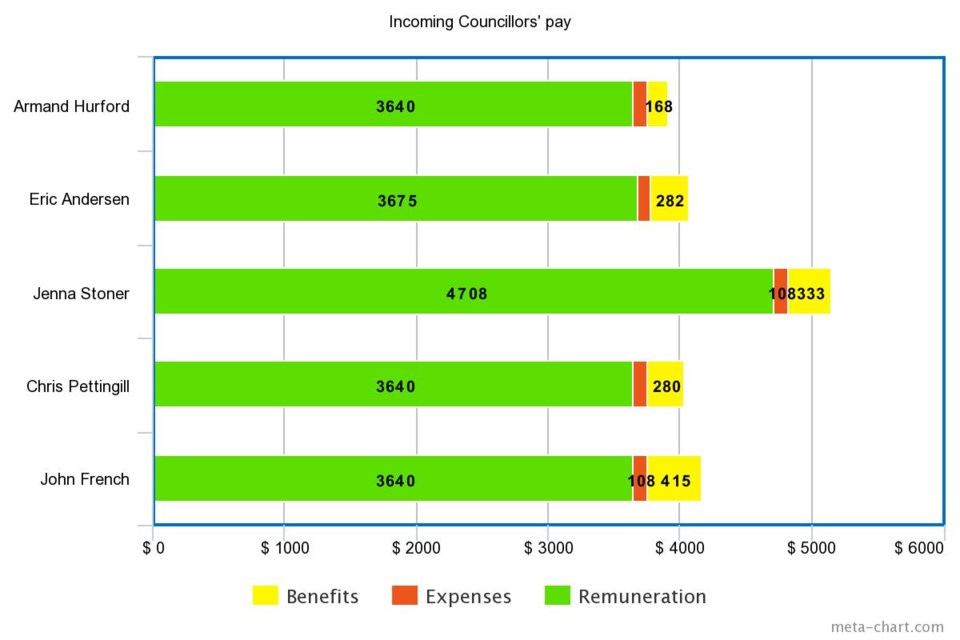
For elected officials, politicians have been separated into incumbent and incoming categories, as newly-arriving councillors will have significantly lower pay. They would’ve only been paid for the last few months of 2018.
Finally, some councillors who’ve served the same amount of time may receive more cash depending on how many times they’ve served as acting mayor.
For example, Coun. Doug Race and Coun. Jenna Stoner each served as acting mayor for a month after the 2018 elections in October, during November and December, respectively.
Stoner’s compensation is noticeably higher than the other newly-arriving councillors.
Have a look below to see the compensation of elected officials, as well as the Top 10 highest paid municipal staffers.
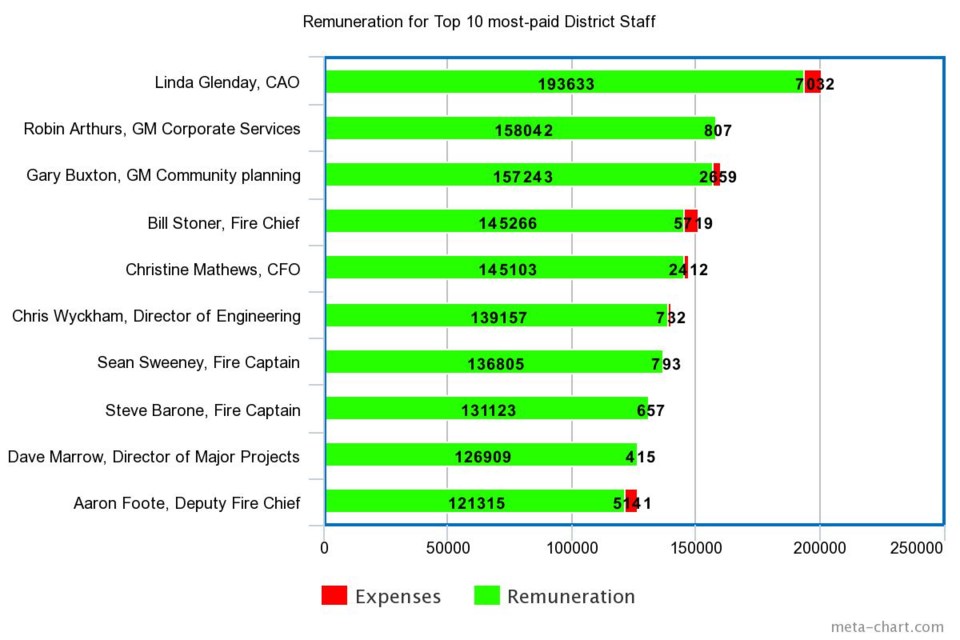
— The largest staff pay raises, based on annual remuneration increases —
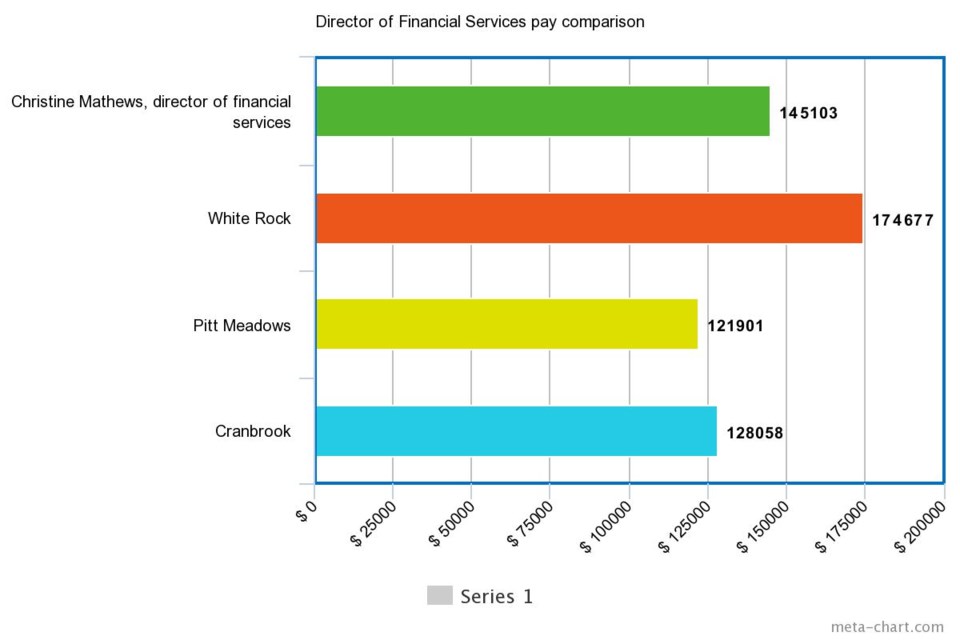
On the high end, the largest raise in this group went to chief financial officer Christine Mathews, who received a 15.86 per cent increase. Her pay was bumped up by $19,867 in 2018 to a total of $145,103.
In second place, CAO Linda Glenday received a raise of $18,550, which amounted to a 10.59 per cent jump. She made about $193,633 in 2018.
In third, Jonas Velaniskis, the director of planning, had a pay bump of about $9,052, which amounted to about 8.23 per cent. He made $118,985 in 2018.
— How does Squamish fare compared with other municipalities? —
To put further context to how much municipalities pay their elected officials and staff, it’s often standard practice to benchmark them against other towns.
Yan said one of the better ways to create an initial snapshot of Squamish is by looking at other towns with similar populations.
To this end, he named White Rock, Pitt Meadows and Cranbrook as reasonable comparisons — they have respective populations of 19,952, 18,573 and 19,259, as of the latest census.
These are quite similar to Squamish’s headcount of 19,512.
However, like all comparisons, Yan noted that population is still an imperfect gauge.
Many towns face specific problems, so duties for the same or similar positions can vary between communities.
Squamish, for example, deals with a massive influx of tourists, while places like Pitt Meadows may not.
The District will also likely not have the same tax base as White Rock, which is considered one of the more affluent communities in the Lower Mainland.
Altogether, Squamish spent $15.3 million on all employee remuneration — including those who made less than $75,000. For employee expenses, the total added up to $233,203. They were given about $1.58 million worth of benefits
For elected officials in council, the municipality paid out $285,893 in remuneration. The officials accumulated $22,658 in expenses and received $36,711 in benefits.
White Rock spent about $13.1 million on all employee remuneration. They spent $205,796 in expenses.
Its elected officials were given $300,942 in remuneration and rang up $35,835 in expenses.
Benefits for staffers and politicians were not listed separately, but collectively, they amounted to $2.15 million.
Pitt Meadows paid out $6.42 million to all its employees, who spent $139,818 in expenses. They received $1.02 million in benefits.
This community’s politicians were paid $220,543 in total and received $6,913 in benefits. They racked up $27,698 in expenses.
Cranbrook paid its workers collectively about $12.18 million, and they incurred $162,988 in expenses. They received about $2.94 million in benefits.
As a group, its politicians made $189,613 and expensed $29,576. They received $12,079 in benefits.
— How do the top staff and elected positions in Squamish compare with other communities? —
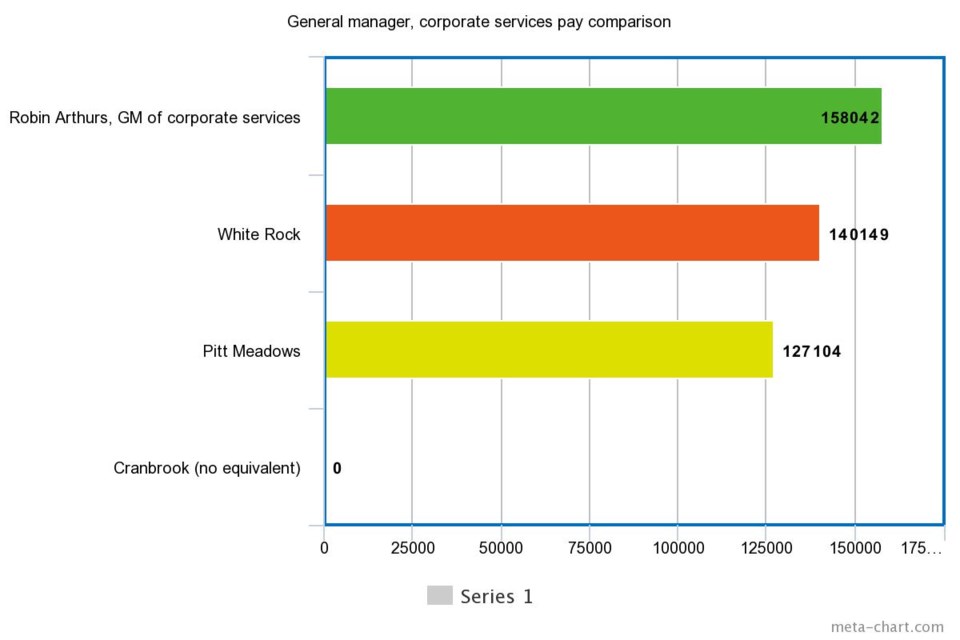
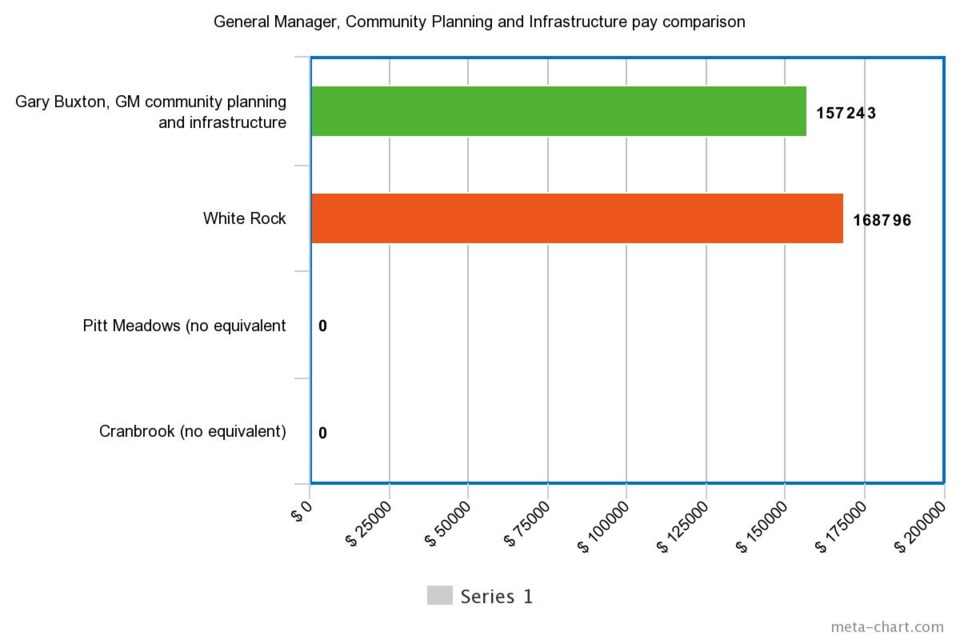
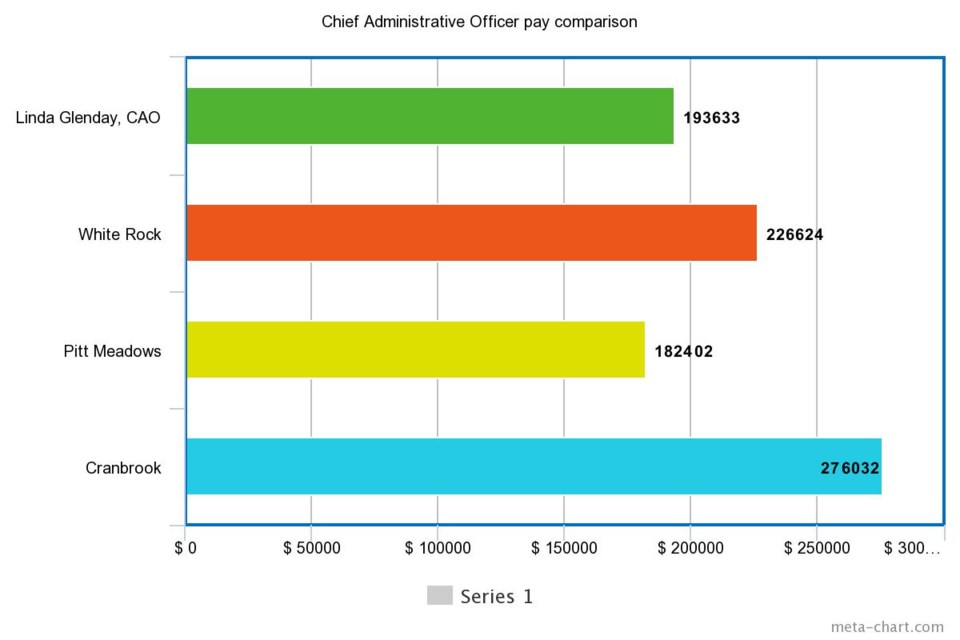
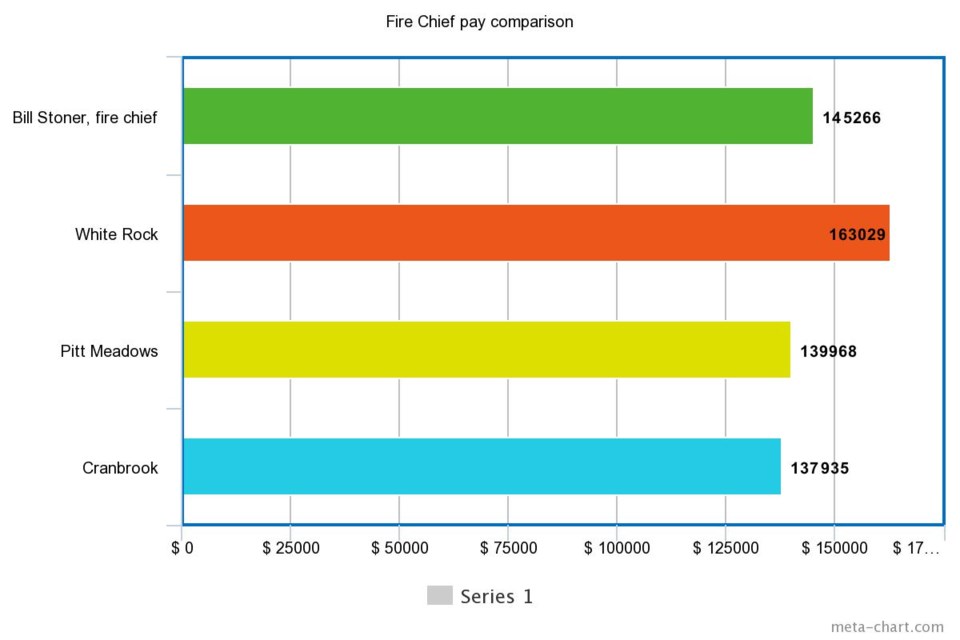
The Chief has compiled comparisons between the remuneration of the five top-earning Squamish municipal staff members with their counterparts in White Rock, Pitt Meadows and Cranbrook.
The top five Squamish municipal staffers are CAO Linda Glenday; Robin Arthurs, general manager of corporate services; Gary Buxton, general manager of community planning and infrastructure; Bill Stoner, fire chief; and Christine Mathews, director of financial services.
See the charts to have a look at how their compensation squares off with others in similar-sized communities.
Not all positions had an equivalent in other municipalities. In those cases, payment figures have been omitted.
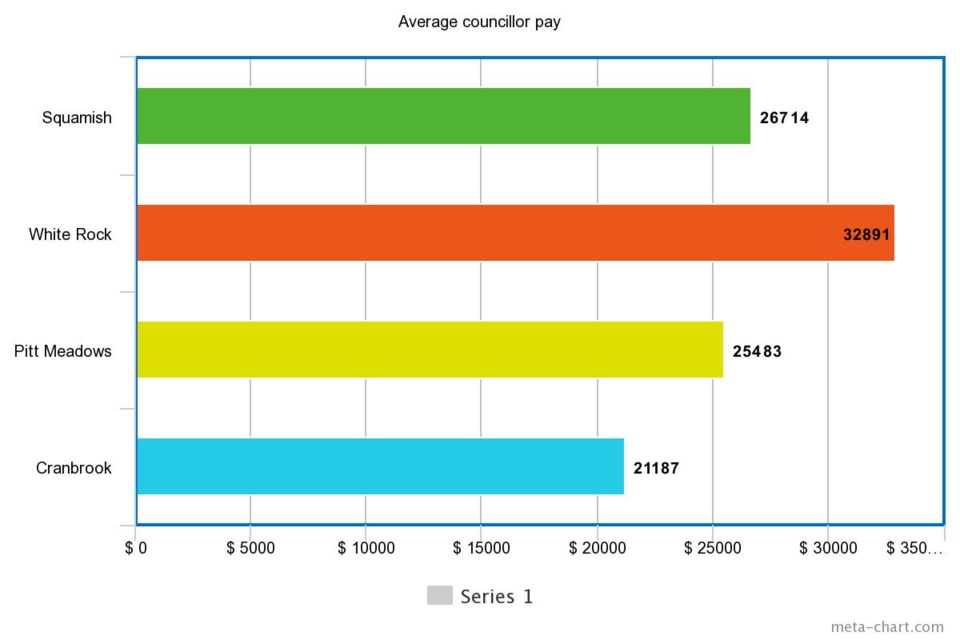
For councillors, The Chief calculated their average pay and compared Squamish with other municipalities.
Average councillor pay calculations only included incumbent councillors. It omitted new arrivals, as their pay would be substantially less. Councillors-turned-mayors were also not included.
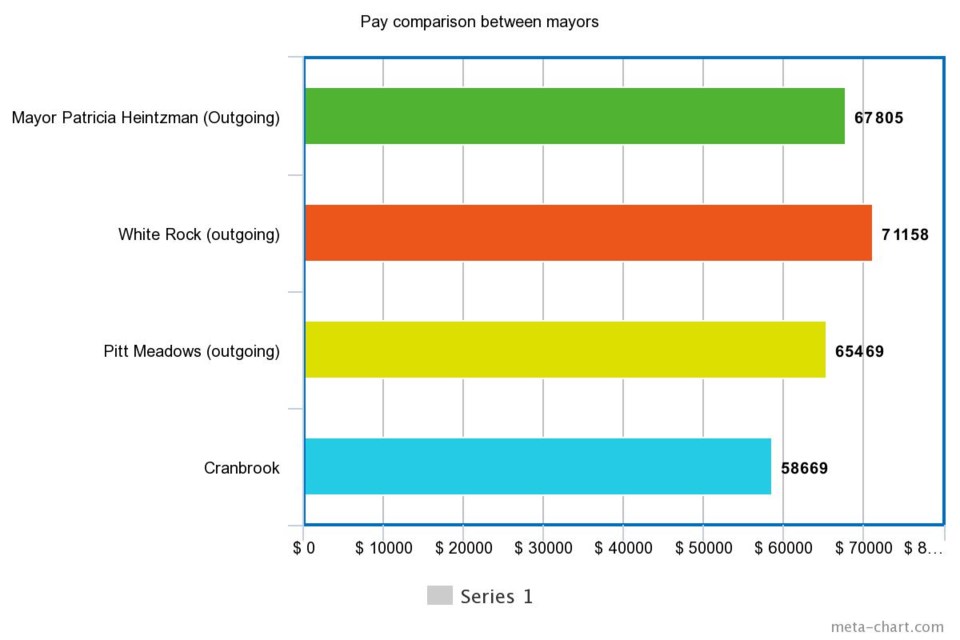
For mayors, The Chief only compared incumbent mayors, as newly-elected mayors wouldn’t be paid for a full year. Outgoing mayors have been labelled, as their pay would presumably be cut short by about two months.